Excel Charting
|
|
|
|
|
|
|
|
|
|
|
|
|
|
Excel Charting
Additional Resources
Excel Charting
Excel Charting | Microsoft Excel XP | Page 2 |
 |
 |
What's on this page... Using the Chart Wizard Chart Wizard - STEP 1 Chart Wizard - STEP 2 Chart Wizard - STEP 3 Chart Wizard - STEP 4 Changing the Chart Type Changing a Chart's Location See also... Charts Modify Chart Elements |
Chart Wizard: STEP 1 of 4
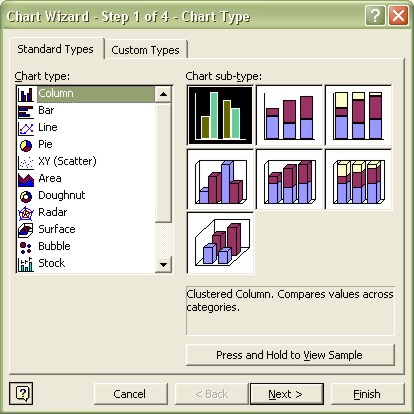
The first step of the Chart Wizard involves selecting the chart type:
 |
|
| 1. | Select the chart type. To use a standard chart type, make your selection in the Standard Types tab. Then choose one of the chart subtypes. To get a preview of how your data will look with the selected chart type, use the button, "Press and Hold to View Sample" below the list of chart subtypes. Click the button, but don't release it. To use a custom chart type, make your selection in the Custom Types tab. |
| 2. | Click the NEXT button to move on to the next step. |
Chart Wizard: STEP 2 of 4
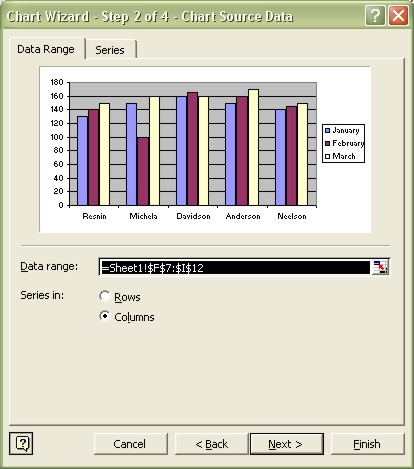
In the second step of the Chart Wizard, you verify (or change) the ranges used in the chart.| 1. | Make sure the range displayed in the Data Range box is the range you want to use for the chart. |
| 2. | If the data Series are in rows, click the Rows
option. If the data series are in columns, select
the Columns option. You'll notice that the dialog box displays a preview of the chart as you choose between Rows and Columns. |
 |
|
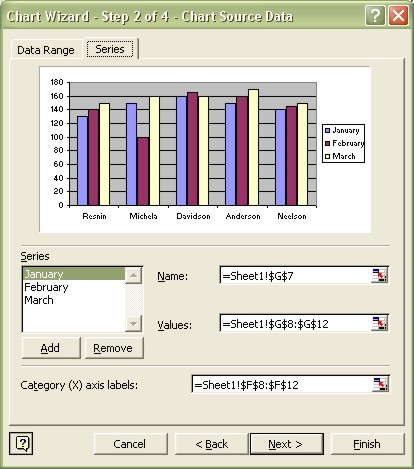
| 3. | If you want to adjust the ranges used for an individual series, click the Series tab and make the changes. |
 |
|
| 4. | Click the NEXT button to move on to the next step. |
 |
The Row and Column selection in Step 2 is an
important choice that has a drastic effect on the
look of your chart. Most of the time, Excel guesses the data orientation correctly but not always. |
| See also.. Charts | Modify Chart Elements |
| Back to Top |
| Return to Excel XP from Excel Charting |
Excel XP Topics
- Tips- Excel Screen Layout
- Navigational Techniques
- Working with Workbooks
- Templates
- Working with Worksheets
- Moving Around
- Move Worksheets
- Copy Worksheets
- Insert & Delete Cells
- Insert & Delete Rows
- Insert & Delete Columns
- Resize Row
- Resize Column
- Editing Data
- Content Color
- Cell Color
- Number Formats
- Fonts
- Alignment
- Text Direction
- Indent Contents
- Merge Cells
- Copy
- Move
- Undo & Redo
- Using Zoom
- Freeze & Unfreeze Titles
- Split Worksheet
- Spreadsheet Data
- AutoFill
- AutoComplete
- Comment
- Find
- Replace
- Spellcheck
- Formulas
- Functions
- Password
- Sorting
- AutoFilter
- Advanced Filter
- Macros
- Charts
- Charting
- Charting Elements
- Gantt Chart
- PivotTable
- PivotTable Calculations
- PivotTable Layout
- PivotTable Format
- PDF to Excel
- PDF-to-Excel Converter
- Excel to PDF Converter